Kendrick Leong
In Workbench we take a deeper look at data transformation for our stories.
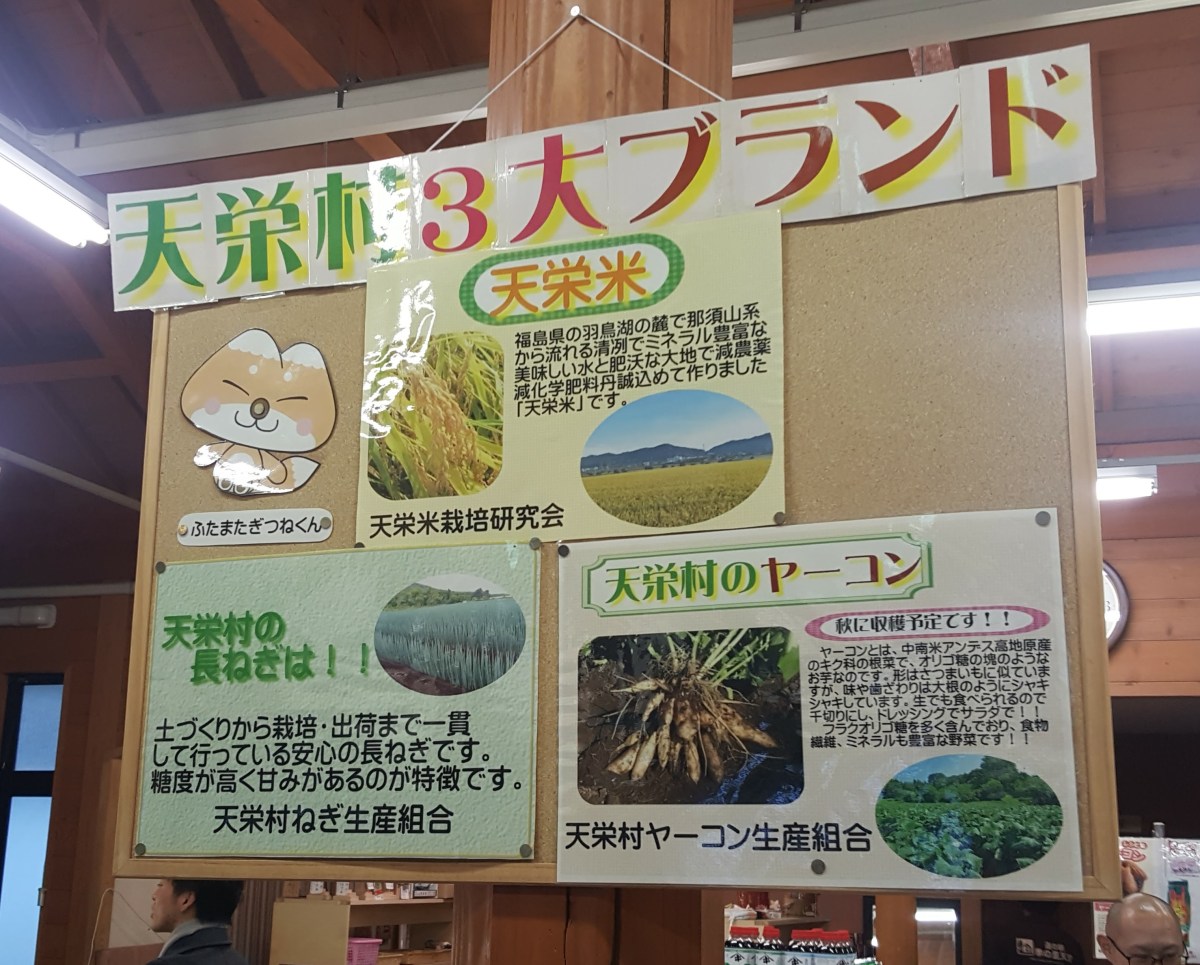
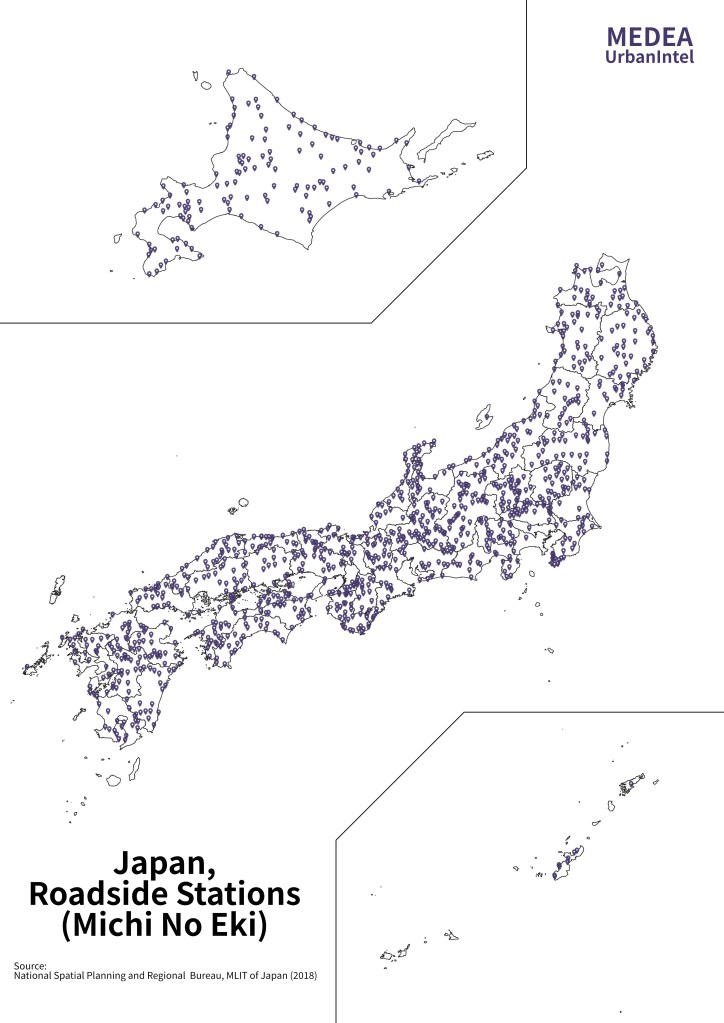
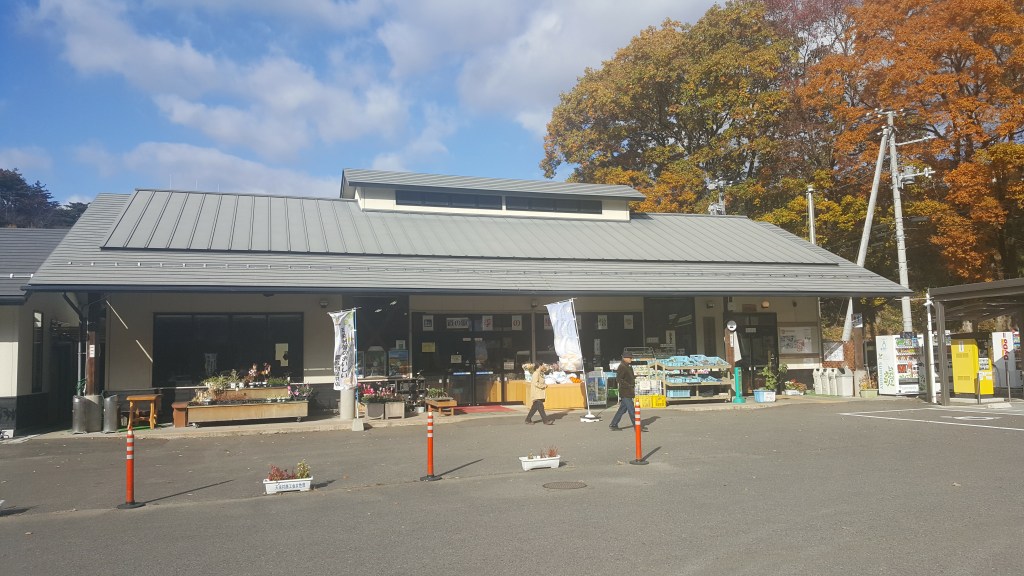
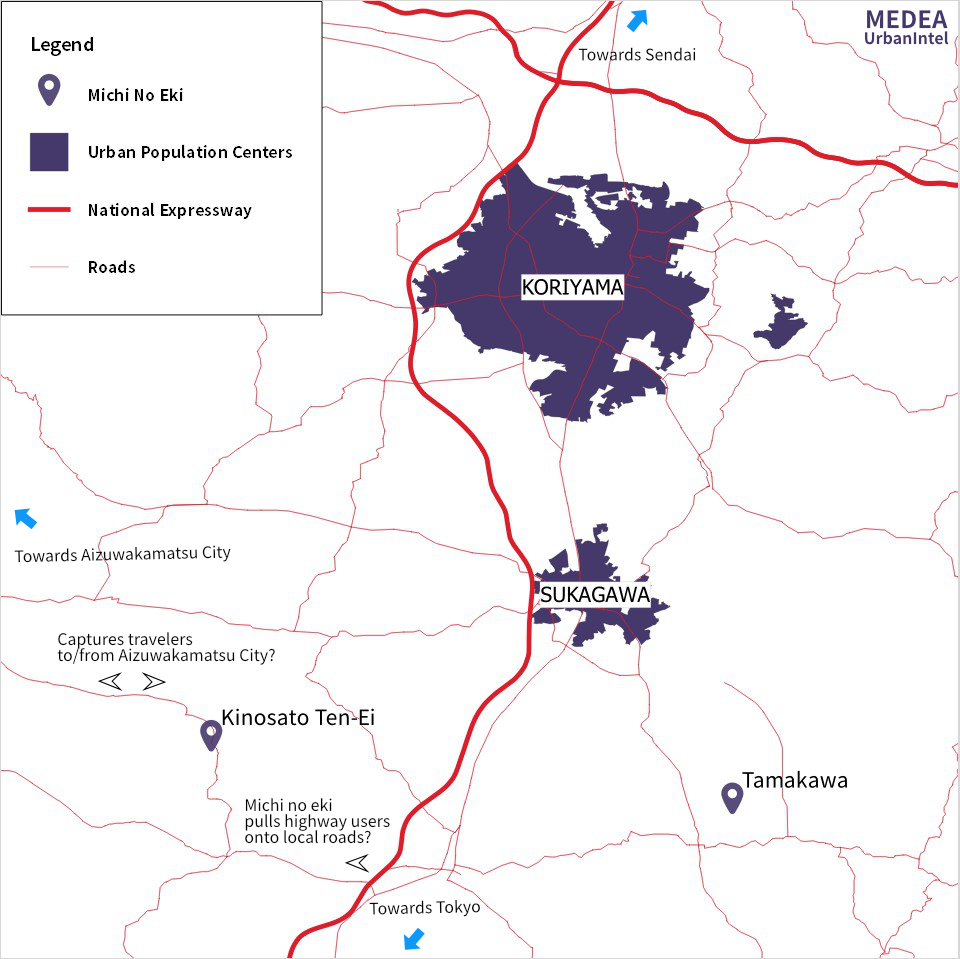
In our last post we examined roadside stations, or michi no eki, in Japan, and zoomed in on Kinosato Ten-ei roadside station, in Ten-ei Village, Fukushima Prefecture. To write these stories, we often rely on open datasets, which are downloadable for use, reuse, and modification. Some examples, specifically from the Kinosato Ten-ei story, include the locations of michi no eki (Japan MLIT, Japanese only) and population censuses (Ten-ei Village, Japanese only). An alternative to open datasets is of course primary data collection, although recent conditions have made going out into the field difficult.
So from the comfort of our homes, we can look to data directories, such as Data.go.jp (English available), which inventories open datasets by Government Agencies, Local Governments, and thematic groups (manufacturing, housing, etc.). Most countries have some kind of open data directory; this one is run by Japan’s Ministry of Internal Affairs and Communications.
Let’s cycle back through the directory’s list of local government databases to find Ten-ei Village’s. Here we find some datasets on population, schools, and disaster resources, such as the locations of AEDs (defibrillators) and evacuation centers. Naturally, data reporting standards and activities vary from organization to organization and government to government, but luckily, we can find datasets in the first place for a village of this size.
For many open datasets, downloaded data takes the form of .csv (comma separated values). These files are read by your spreadsheet software (Excel, Pages, etc.) or data analysis platform (R, Python, etc.). Opening the resident register file for November 2020 (Reiwa 2), we get the following table:
| Village Section | Households | Males | Females | Individuals |
| Makimoto | 504 | 796 | 794 | 1,590 |
| Osato | 290 | 500 | 517 | 1,017 |
| Hiroto | 902 | 1,187 | 1,167 | 2,354 |
| Yumoto | 290 | 280 | 283 | 563 |
| Total | 1,986 | 2,763 | 2,761 | 5,524 |
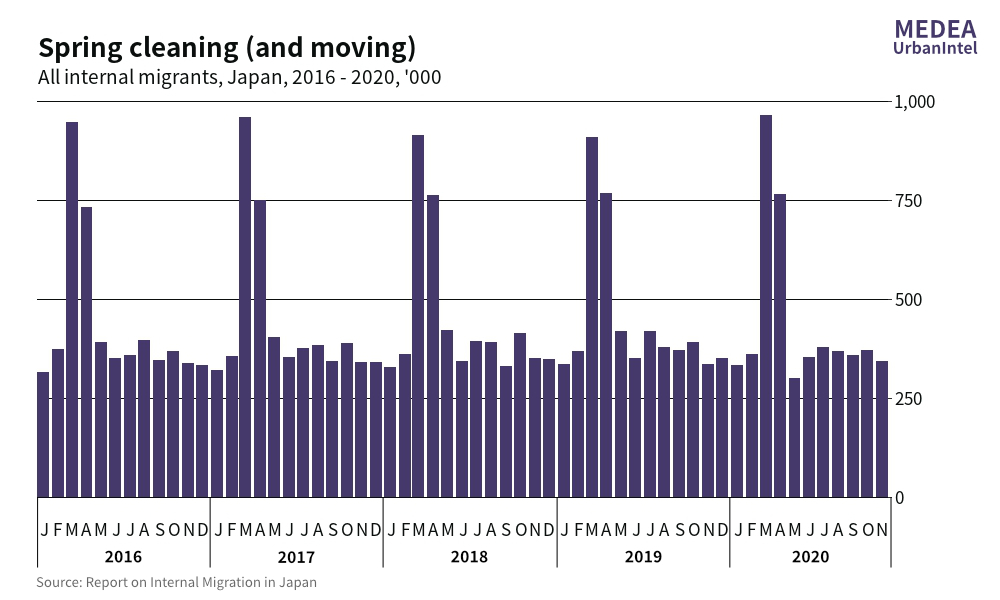
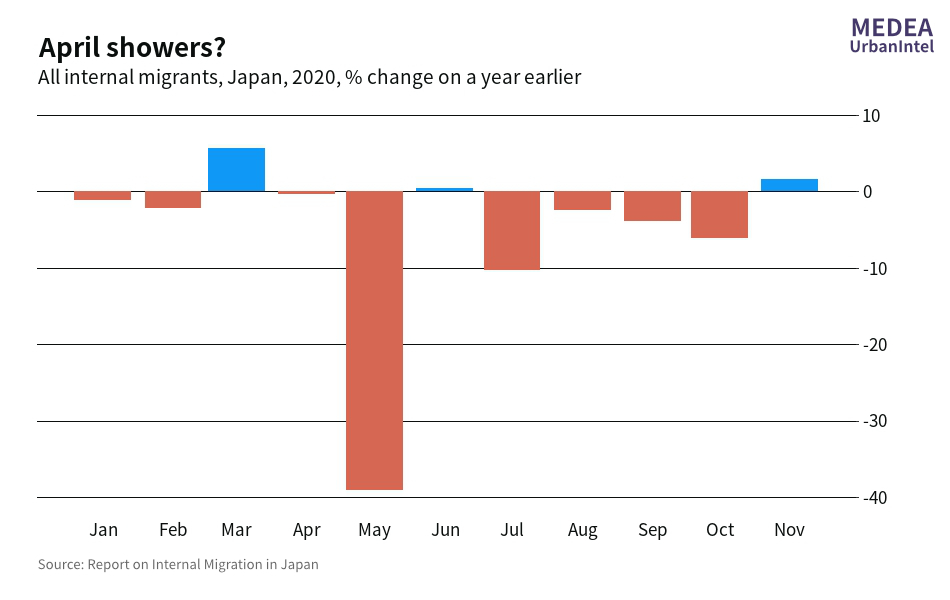
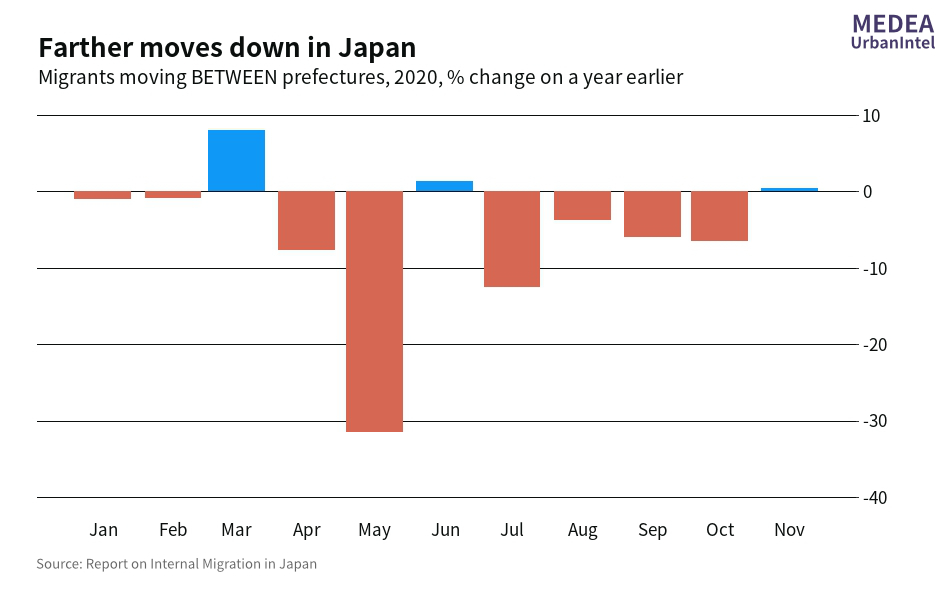
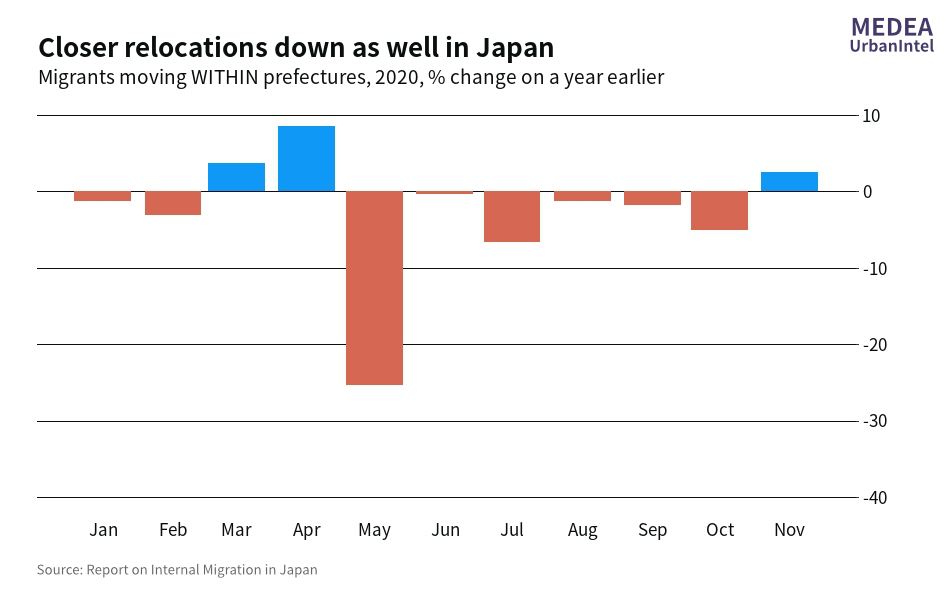
Working with Japan open datasets, often the first line of work is translating from Japanese (as was the case with this table). We can see in the table above that Ten-ei Village is further divided into sections: Makimoto, Osato, Hiroto, and Yumoto. However, this data is but one slice of a larger picture; with population data we are often interested in longitudinal trends – changes over time, and their magnitudes. We took a larger, country-wide look at these trends in our first post.
So let’s bring in not only the data from November 2020, but also for the following months until March 2021 (the last month for which data is available). We are interested in the number of individuals by village section, which will involve some data merging and pivoting. After we attach date fields to each respective dataset, we pivot to a “long” format and get the following table:
| Village Section | Date | Individuals |
| Makimoto | November 2020 | 1,592 |
| Makimoto | December 2020 | 1,590 |
| Makimoto | January 2021 | 1,583 |
| Makimoto | February 2021 | 1,579 |
| Makimoto | March 2021 | 1,578 |
| Osato | November 2020 | 1,024 |
| … | … | … |
| Yumoto | March 2021 | 553 |
Now that we have longitudinal data, spanning the length of November 2020 to March 2021 for each of the Ten-ei Village sections, we can throw it into a graphics software to get a population graph. At MEDEA, we use R and R Studio due to its flexibility and customization options. With just the data we have prepared so far, we get the following graph:
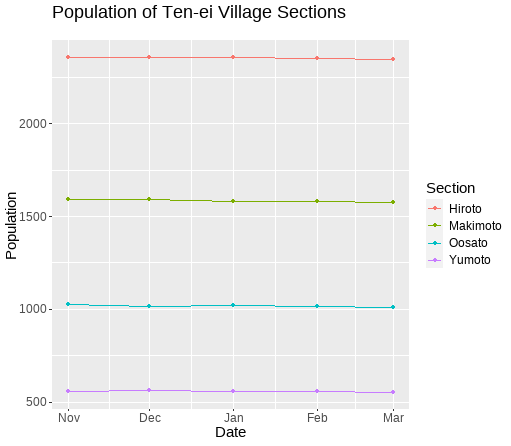
Next we apply the MEDEA UrbanIntel visual language, including color palettes, fonts, and graph formats. We also add labels for each of the points, but this can be omitted to simplify the graph:
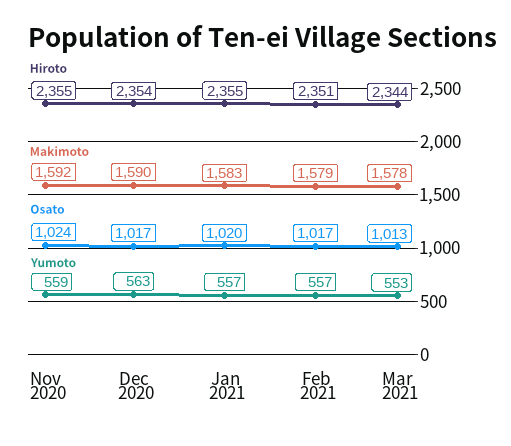
There is not that much to remark on here; populations stayed relatively constant across the village sections. We can see which sections had more people and which had less, and a miniscule downward trend over the months, with all sections losing residents by March 2021. Alternatively, this data can (and probably should) be presented as a table, which is still able to capture the longitudinal trend:
| Village Section | Nov ’20 | Dec ’20 | Jan ’21 | Feb ’21 | Mar ’21 |
| Hiroto | 2,355 | 2,354 | 2,355 | 2,351 | 2,344 |
| Makimoto | 1,592 | 1,590 | 1,583 | 1,579 | 1,578 |
| Osato | 1,024 | 1,017 | 1,020 | 1,017 | 1,013 |
| Yumoto | 559 | 563 | 557 | 557 | 553 |
So as far as exploratory data analysis with open datasets go, there are many paths from here. We have looked at Ten-ei Village open population data to try to observe longitudinal trends; next we may want to put the Ten-ei Village population in a graph with other village’s populations in Fukushima Prefecture. We may also want to continue looking for open datasets that capture a longer time horizon of the Ten-ei Village population. It would be interesting to see population dynamics for the village over ten, twenty, or even fifty years.
To sum up, open datasets provide a great foundation for exploratory data analysis, as we have walked through in this post. Of course, the exploratory part is limited by what data is available, and it might be a good idea to combine multiple open datasets (Ten-ei Village’s and another village’s, for example). We can also bring in other datasets (migration comes to mind) to connect various piecemeal efforts, made by local governments and government agencies, into a larger data mesh that tells more detailed urban stories.